
In addition to the chromosomal DNA present in the nucleus of our cells, there exists also a circular and much smaller DNA molecule in cell structures called mitochondria (mtDNA). As mitochondria play a dominant role in energy conversion, many genes on the mtDNA encode for enzymes of the respiratory chain. The other genes encode for tRNAs and rRNAs. More about mtDNA you can find in the background information.
Although the human mtDNA is a circular molecule of only about 16,500 base pairs, we decided to render the images as well in rectangular 2-dimensional images as the linear chromosomal DNA. We also kept the same colors for the bases. Naturally, the mtDNA images are much smaller, so we were looking for the best image width.
While searching, we found that the mtDNA shows something like a fine regular grid at particular image widths. The grid returns when changing the width for three pixels, but does not appear when changing the width for one or two pixels (px). So, one can see the grid for image widths e.g. of 47 px, 50 px, 53 px and 128 px, but not for images with 51 px and 52 px width.
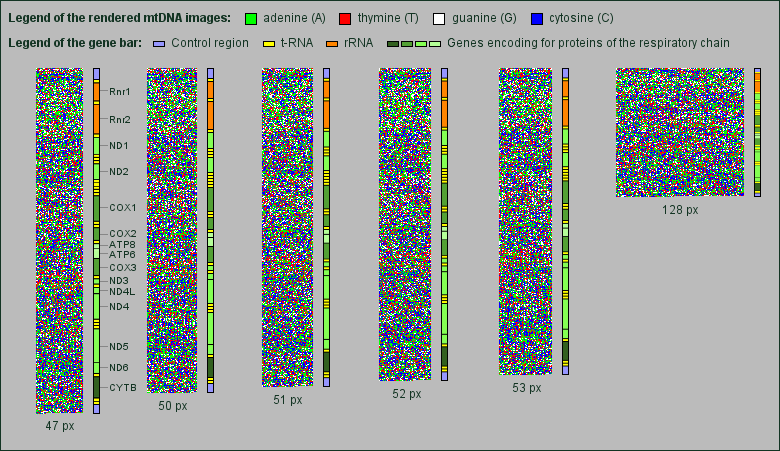
Rendered images of the human mtDNA in various image widths.
Next to each rendered mtDNA image we added a bar showing the proportional position and length of the genes encoding rRNAs, tRNAs and proteins of the respiratory chain.
It is not possible to extract the grid more visible by rendering the images with only one or two bases in the same color, e.g. blue, and neglecting the other bases by setting them to white. Therefore the grid gives the impression to be composed of all four bases.
Interestingly the grid appears mainly in the area of genes encoding for proteins of the respiratory chain, in particular genes for NADH dehydrogenase subunits and cytochrome oxidase subunits.
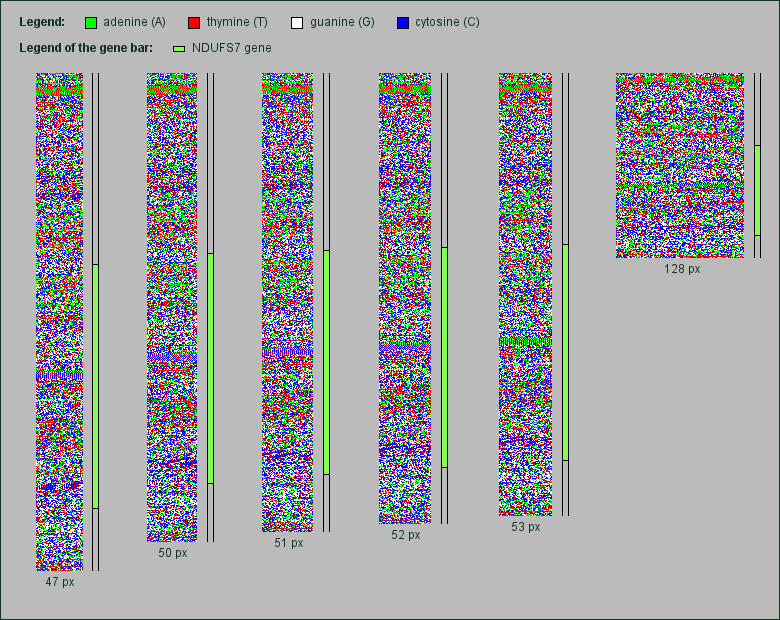
Part of the human chr. 19 containing the NDUFS7 gene rendered in various image widths. Click to enlarge.
To check if related genes lying on the chromosomes also show some kind of grid, we rendered six chromosomal genes for NADH dehydrogenase subunits (NDUFAB1 and NDUFB10 of chromosome 16; NDUFA3, NDUFB7 and NDUFS7 of chromosome 19 and NDUFV3 of chromosome 21). These subunits form part of complex I of the mitochondrial respiratory chain. We also rendered two genes for subunits of the cytochrome oxidase complex (COX6B1 of chromosome 19 and COXAI2 of chromosome 20), which catalyzes the electron transfer in the respiratory chain.
Although all images of these genes were rendered in the same image widths as the mtDNA pictures above, in none of them appears some kind of grid. As an example, we show here a rendered chromosomal part of 27,000 base pairs size of chromosome 19. Within this part lies the gene NDUFS7, a subunit of the NADH dehydrogenase spanning 11,675 base pairs.
As one can see, a grid does not appear neither in the area of NADH dehydrogenase gene nor in the other regions of this chromosomal detail. But an interesting side effect is the visualization of the transformation of the short repeating pattern stripes when changing the image width.
Thus, the finding of a kind of grid in DNA images seems to be very specific for proteins of the respiratory chain whose genes lie on the mitochondrial DNA.
Species comparison of the mtDNA
As there appears a kind of grid in the human mtDNA, we wanted to know if there are similar structures in the mtDNAs of other species. Therefore we chosed the same animals as in the species comparison of chromosome 1 and rendered their mtDNA into images with 50 px width.
Again we added next to each rendered mtDNA image a bar showing the proportional position and length of the known genes encoding rRNAs, tRNAs and proteins of the respiratory chain.
One can see a kind of fine grid in all species. Surprisingly it appears without the need of changing the image widths even though the mtDNAs of the different species vary somewhat in length and the starting point of each sequence is different. Also the composition of the dominant bases vary. While the grids of human, chimpanzee, macaque and chicken mtDNA appear to be mainly made of cytosine (blue), the grids of the other species appear to contain more adenine and thymine (green and red).
With the gene bar next to the DNA images, one can clearly distinguish between positions of the genes encoding rRNAs and genes encoding proteins of the respiratory chain. As all genes are equal or at least very similar between the different species, the position of these genes can be easily located for all species. For example, the position of the NADH dehydrogenase subunits 1 and 2 (ND1, ND2) can be spotted due to a broad bluish banding and the NADH dehydrogenase subunit 6 (ND6) due to a narrow greenish banding.
Also it can be clearly seen that in all species the grid exclusively appears in the region of the genes encoding the proteins of the respiratory chain. This leads to the suggestion that the particular DNA sequence causing the grid might play a significant role in (evolutionary) DNA genetics.
With the mtDNA images it is shown that the way of visualization the genetic code we use helps to recognize structures and repeating bases faster and that it is possible to get a quick overview of different parts and genes in the DNA sequence by resizing an image.
Base exchanges and amino acids
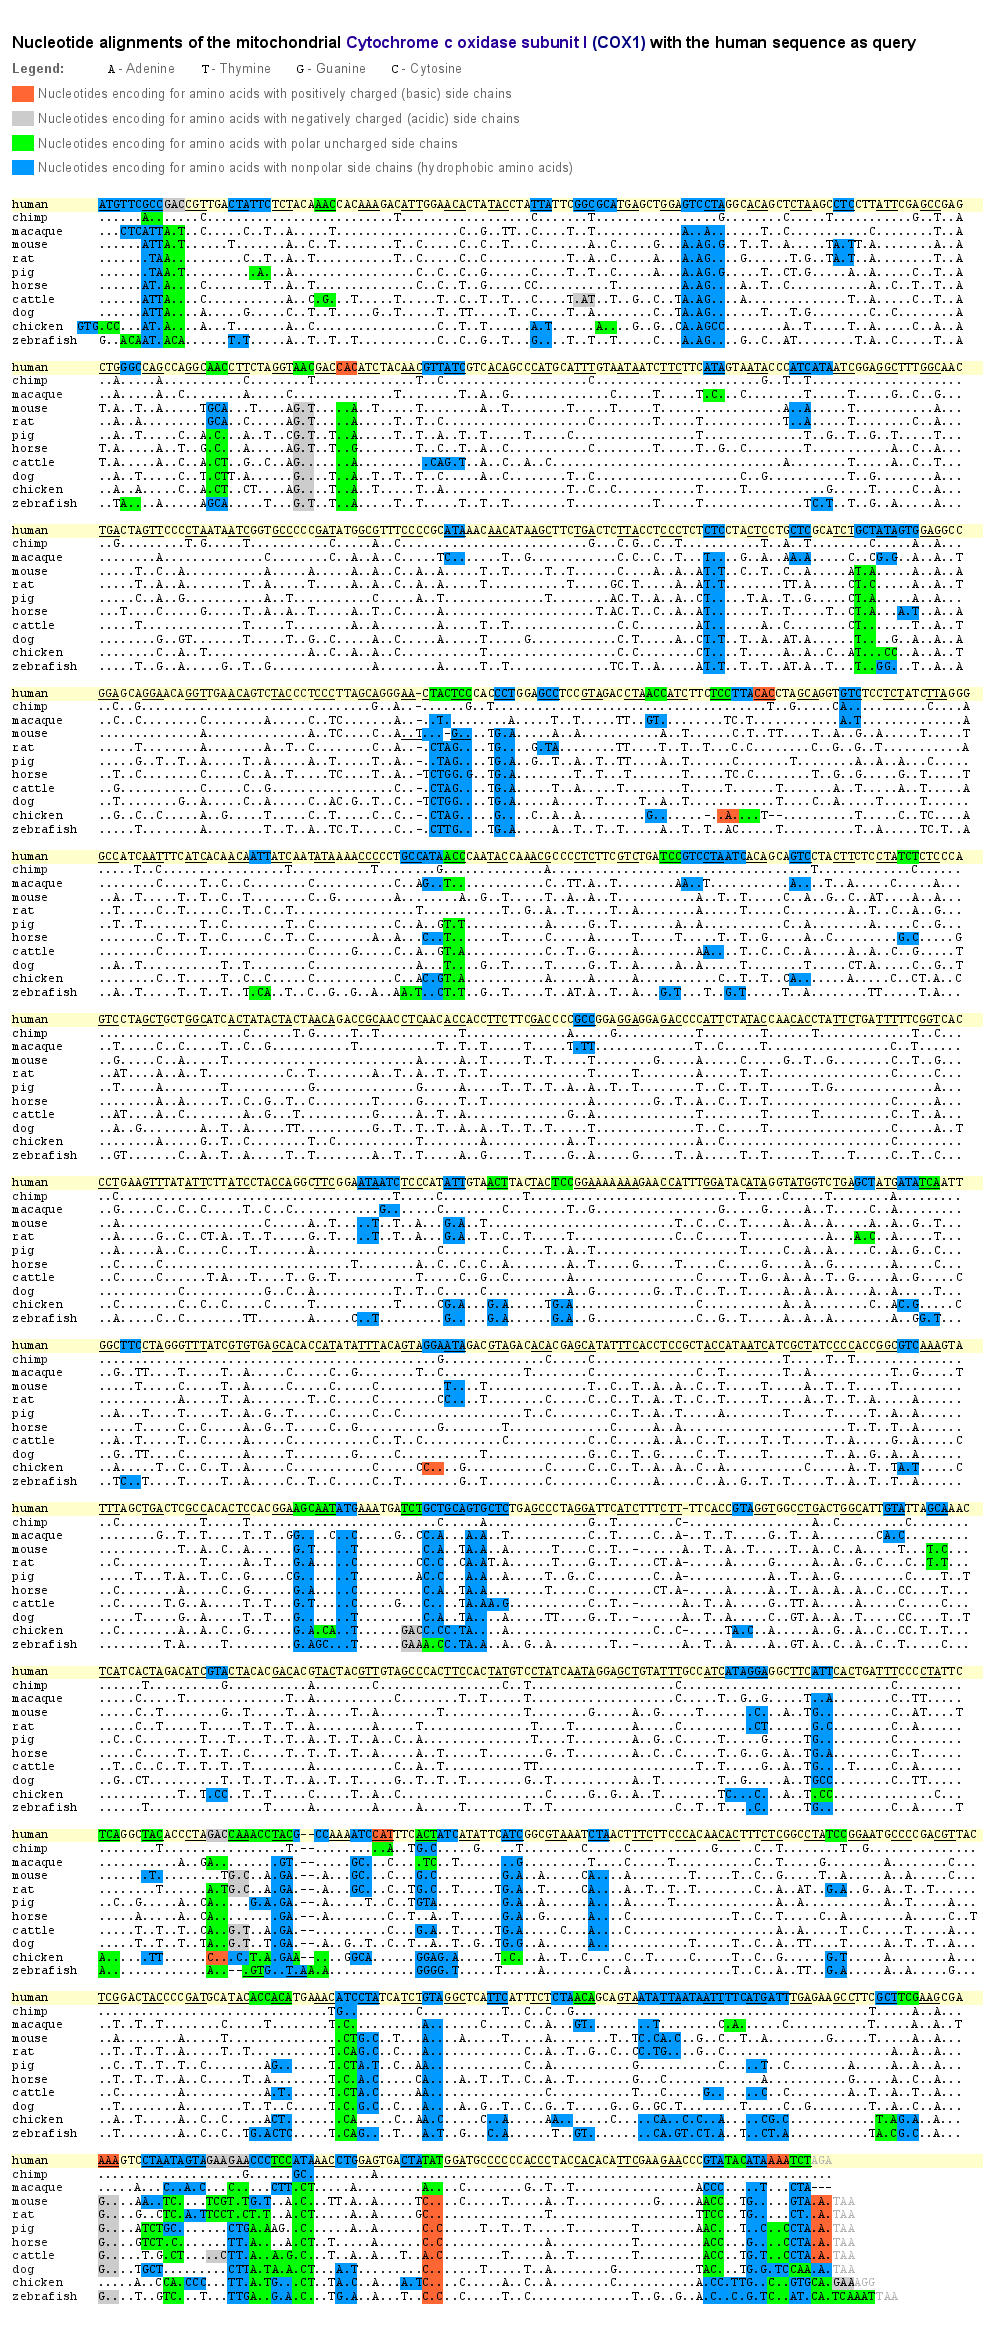
Nucleotide alignment of the COX1 gene. Click to enlarge.
To get a deeper insight into where exchanges of the bases in the mtDNA exactly occurred during evolution, we aligned for our 11 species the nucleotide sequences of the cytochrome oxidase subunit I (COX1) as a representative for those genes, which lie within the fine grid of the mt-DNA images. Base exchanges occurred significantly often at the third position of a nucleotide triplet. As in the mtDNA images the fine grid correlates to every third base/pixel, when changing the image width, that’s why the composition of the dominant bases of the grid vary, but the grid itself remains visible.
The reason of why the exchanges occurred so often at the last position of a nucleotide triplet is constituted in the degeneracy of the genetic code. This degeneracy is caused by a redundancy allowing that several amino acids are encoded by various nucleotide triplets which differ mostly in one singular base. Furthermore, this base is generally located at the third position of the triplet. The base pairing at this site between the codon triplet of the mRNA and the anticodon triplet of the tRNA is weaker than at the first and second base position and might lead to non standard base pairing (“wobble hypothesis”). That means, that an exchange of a base at the third position of a codon triplet by a point mutation does not inevitably lead to an assembly of a wrong amino acid into the protein and therefore to a modification of this particular protein.
Thus, the redundancy of the genetic code as well as the wobble effect result in a relatively high fault tolerance for point mutations at the third position of a nucleotide triplet. During evolution, at this position base exchanges could establish much more often without changing the amino acid sequence. As one can see in the example of COX1, only a small part of all occurred base exchanges caused a change of an amino acid. Even so, a lot of these amino acid changes may not affect the protein function when the side chain characteristics of the substituted amino acid are maintained.
The side chain characteristics are responsible for the spatial orientation of the amino acid within the protein. For example, as proteins normally have a watery environment, hydrophobic amino acids are more likely orientated inside the protein whereas hydrophilic amino acids are rather located outwards. In the COX1 example all amino acid exchanges are color-marked according to their characteristics.
In another picture, we rendered images out of the amino acid sequences of all mitochondrial proteins giving each amino acid one particular color. To be able to compare the effect of an amino acid exchange between the different species we color-marked the amino acids up to their side chain characteristics: amino acids with nonpolar side chains got blue tones, those with polar uncharged side chains got green tones, the basic amino acids got red tones and the acidic ones got gray tones.
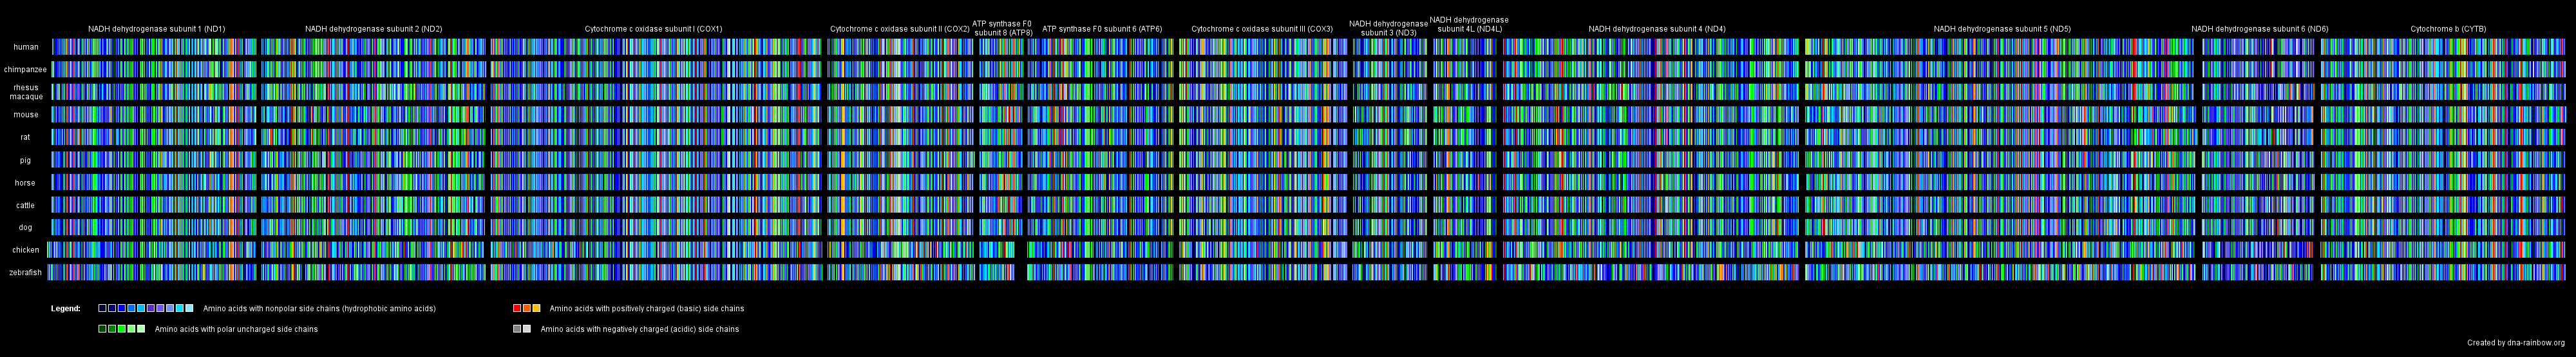
Amino acid alignment of the mitochondrial encoded proteins. Click to enlarge.
Acknowledgment
Best thanks to Justin Cotney, Yale University, for the incentive for working with mitochondrial DNA and for critical discussion.