
Ideograms are a schematic representation of chromosomes. They show the relative size of the chromosomes and their banding patterns. A banding pattern appears when a tightly coiled chromosome is stained with specific chemical solutions and then viewed under a microscope. Some parts of the chromosome are stained (G-bands) while others refuse to adopt the dye (R-bands). The resulting alternating stained parts form a characteristic banding pattern which can be used to identify a chromosome. The bands can also be used to describe the location of genes or interspersed elements on a chromosome.
Below you can see an ideogram of each human chromosome. Next to the known schematic representation we added a chromosome rendered from DNA data. The G-bands, areas with proportional more A-T base pairs, are normally colored black in schematic representations. To compare the schematic ideograms with our rendered chromosomes, we colored the A-T bases black and the G-C bases white. Blue areas in the rendered chromosomes identify bases not known yet.
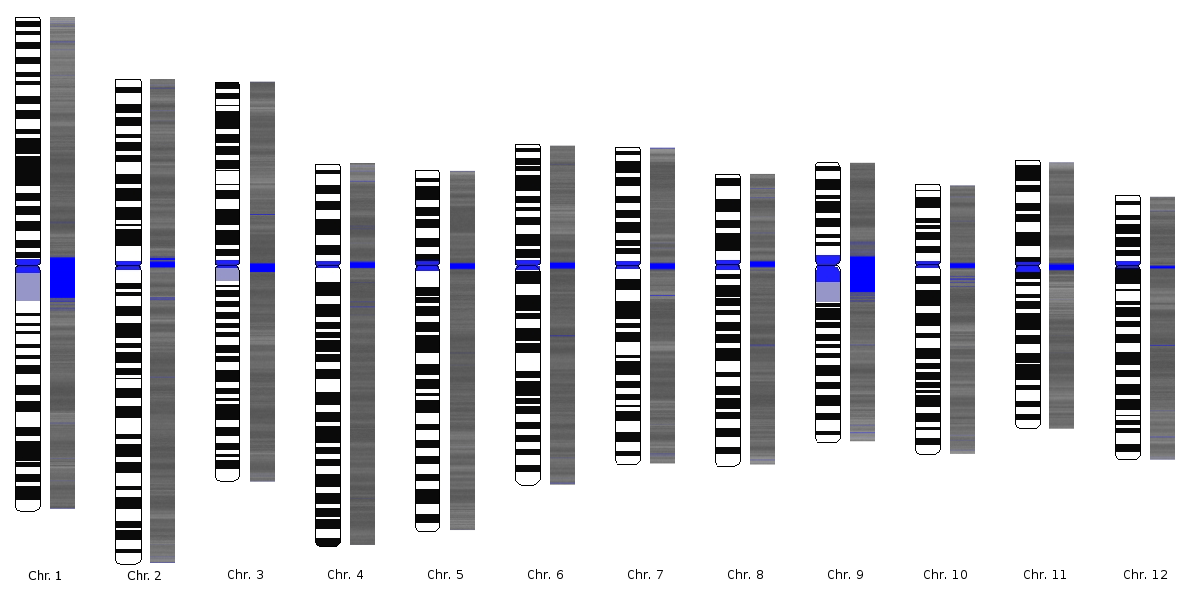
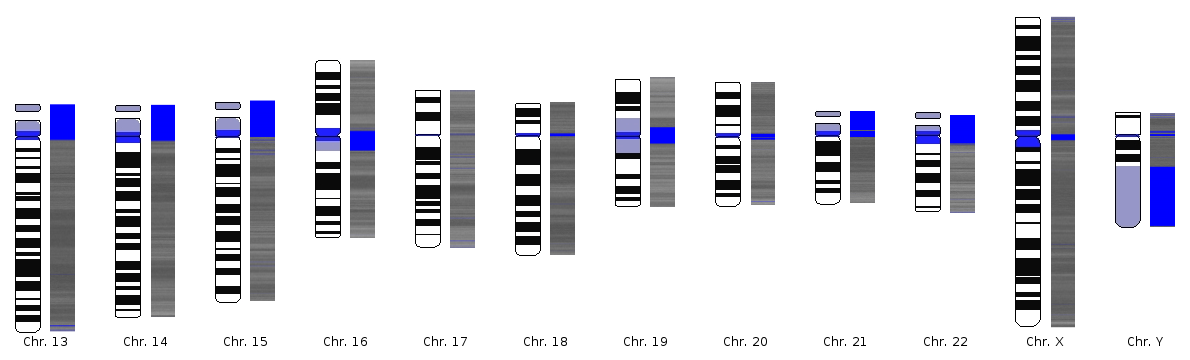
Computer generated ideograms next to the corresponding rendered chromosome images
The results are interesting. When comparing the schematic ideograms with the rendered chromosomes from our project, a significant conformance can be seen. Most black areas on the left side show also black areas on the right side and white areas are also white on the “digital” chromosomes.